Print Generic for testResult S3 Class
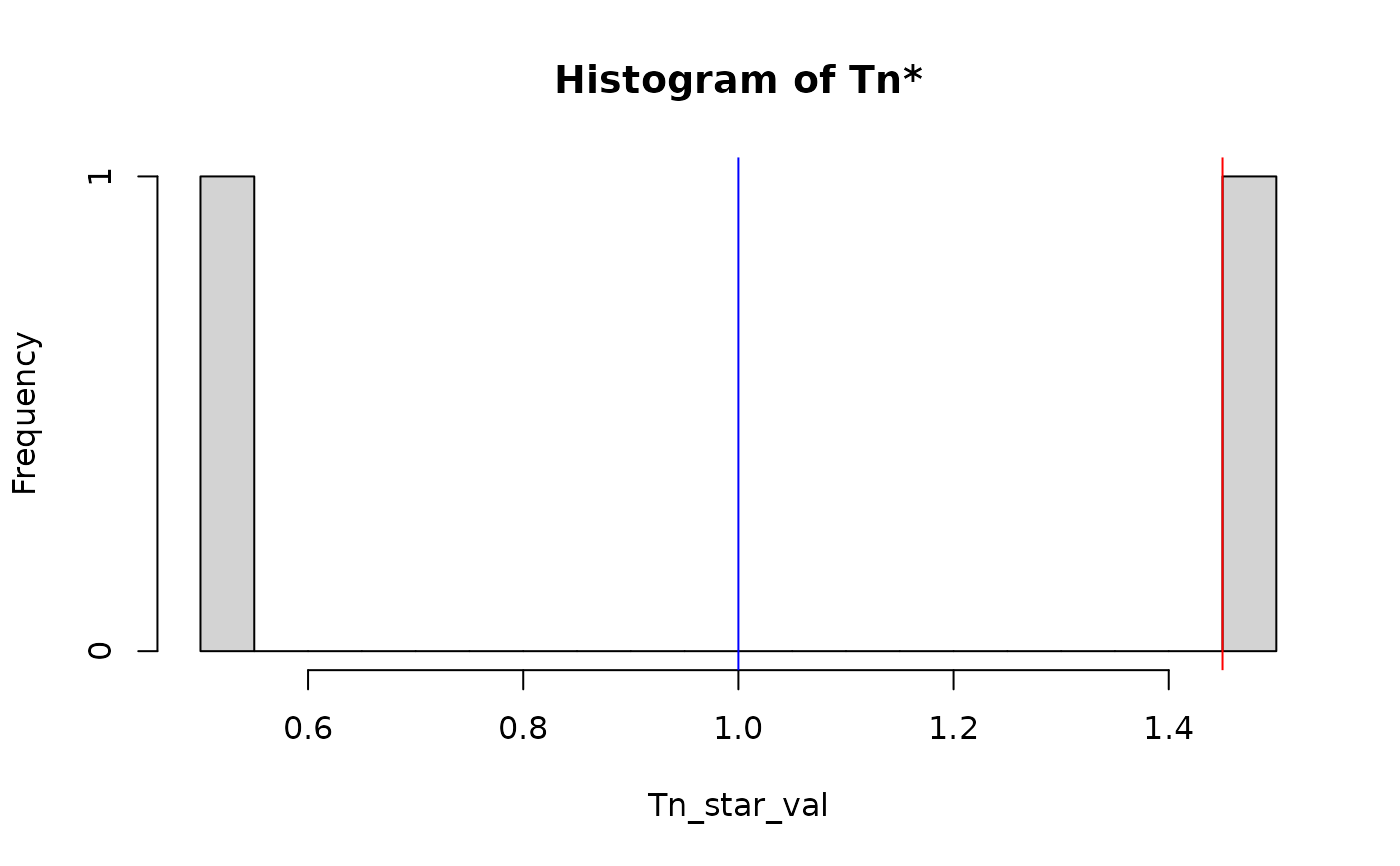
plot.testResult.RdPlots a histogram of \(T_n^*\) with \(T_n\) marked as a blue vertical line and \(c_\alpha(T_n^*)\) (the critical value) marked as a red vertical line
Usage
# S3 method for class 'testResult'
plot(x, ...)Examples
res <- new_testResult(1, c(0.5, 1.5), 0, 0.5, "equality", 2, 0.05, 0.1, 0.1)
plot(res)